


The overview in Numiron provides a quick and easy to understand view of how costs, revenue and profit develop during the year. With charts and reports, you're always in control of your finances without the need for complex reporting.
Costs for the period
At the top of the overview is a graph Costs for the period, which shows the evolution of costs by month. Using the year switch (e.g. 2025, 2024, 2023) you can easily select the period you want to analyse.
The chart distinguishes:
- Costs booked - all documents recorded for the period
- Outstanding costs - commitments pending payment
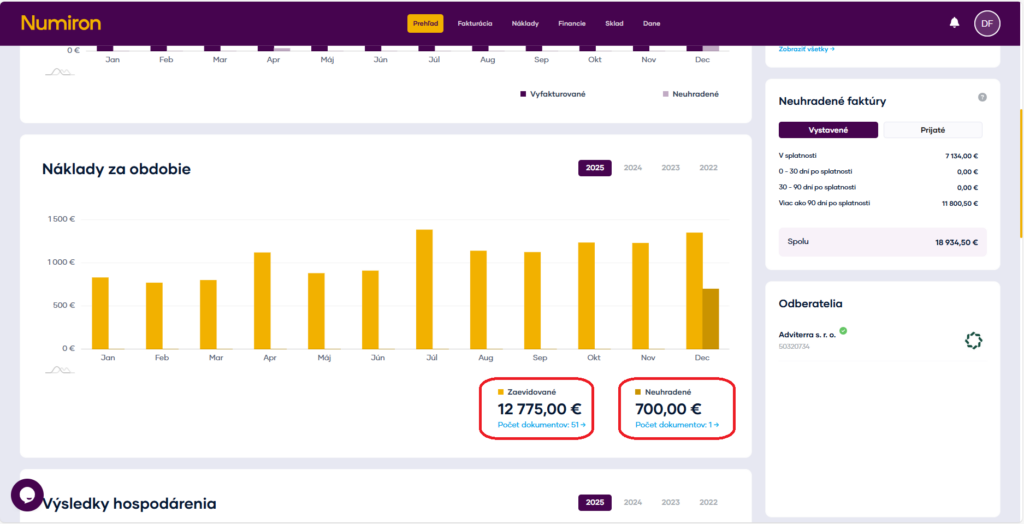
You can also see the total amounts and the number of receipts below the chart, so you can quickly see how much your business has cost you in a given period and how much of the costs are still outstanding.
Revenue, costs and profit
Next chart Economic results compares:
- Returns,
- Costs,
- the resulting profit.
Revenue is shown by bars, while profit is shown by a line. This view allows you to quickly identify months in which expenses had a significant impact on profit, or periods with above-average profitability.
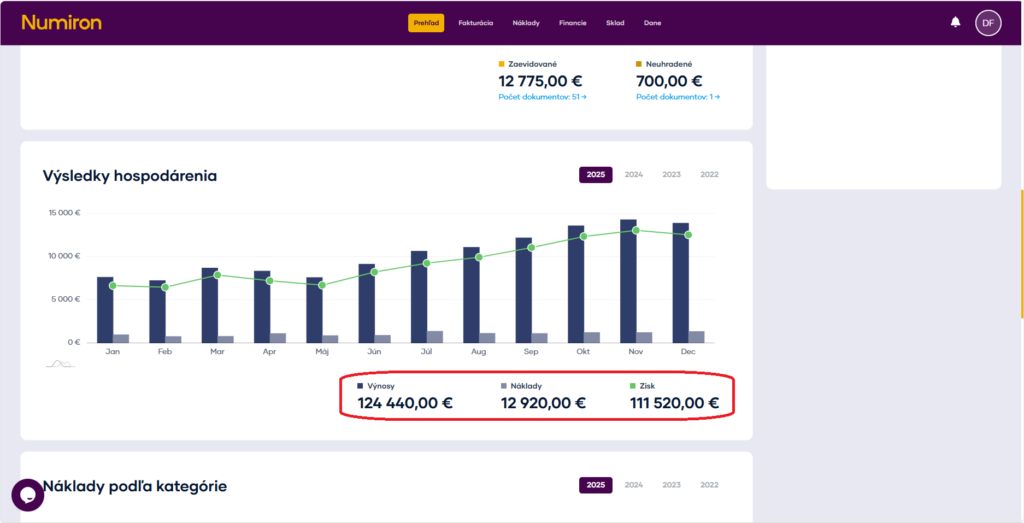
Below the graph, you will also find summary values for the entire selected period, so you can immediately see the overall economic result.
Cost categorisation and pie chart
For a better overview of what your costs consist of, see Cost by category. The allocation of costs is based on delivery type, that you set when uploading or creating an invoice.
Depending on the type of delivery selected, costs are automatically categorised, for example:
- IT services,
- Advice,
- Advertising,
- Material.
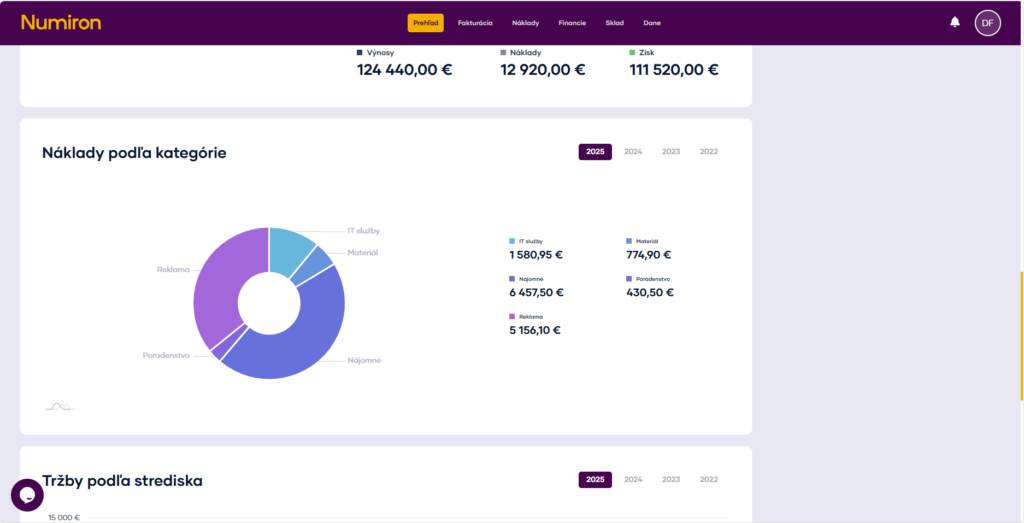
The pie chart then visually displays what share each category has of the total cost.
Nearest reimbursements
In the side of the overview there is a list of Nearest reimbursements. This shows:
- type of liability (e.g. taxes, levies, expenses),
- sum,
- due date.
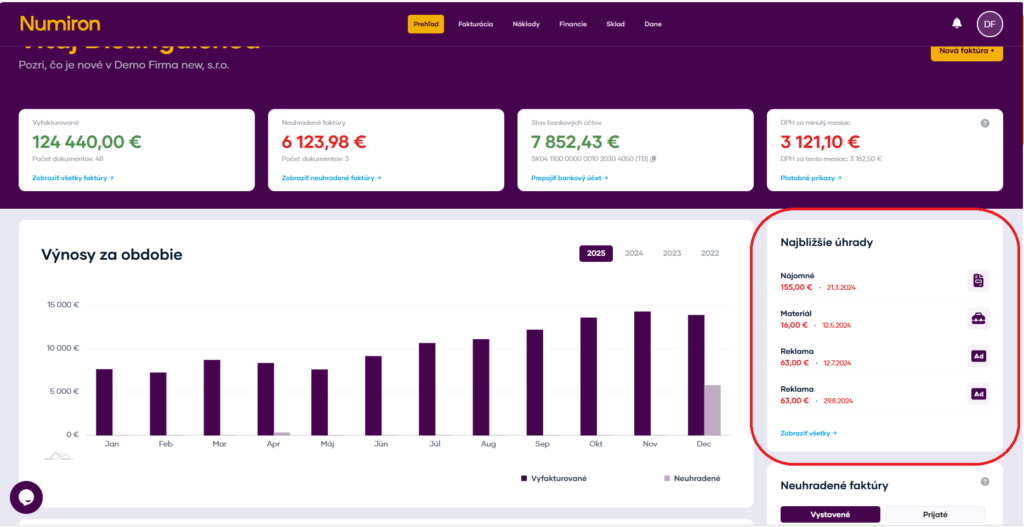
Items with due dates in the near future are highlighted so you don't forget. Click on View all will take you to the full list of commitments.


